Plots
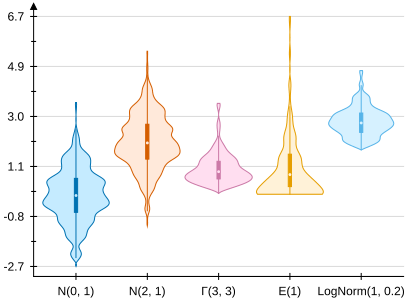
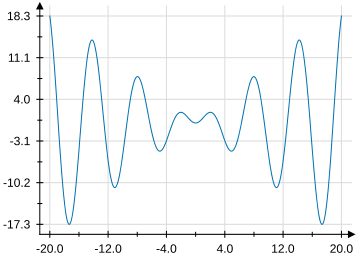
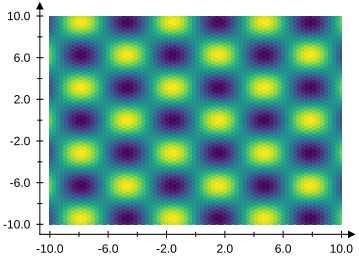
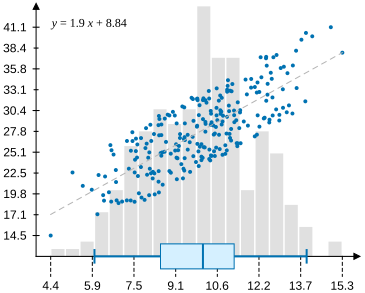
The VectSharp.Plots NuGet package can be used to create a number of plots/charts from different kinds of data, such as histograms, function plots, and more. Plots can be created either by using one of the methods of the Plot.Create static class to create one of the predefined kinds of plots, or by manually composing individual plot elements (such as axes, labels, points…).
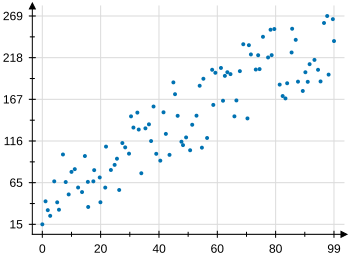
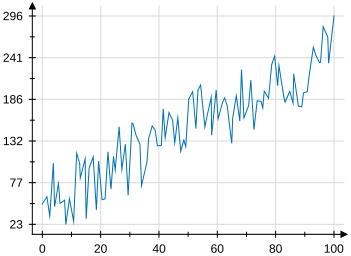
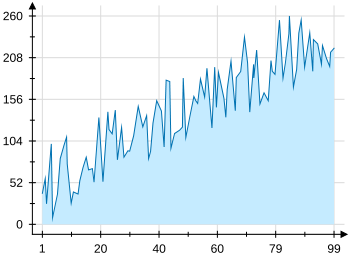
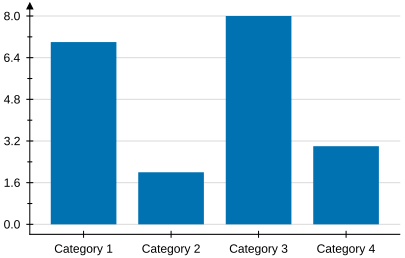
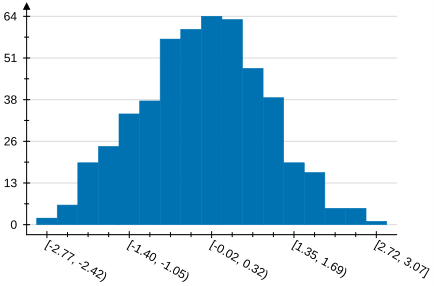
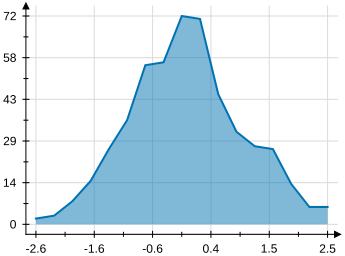
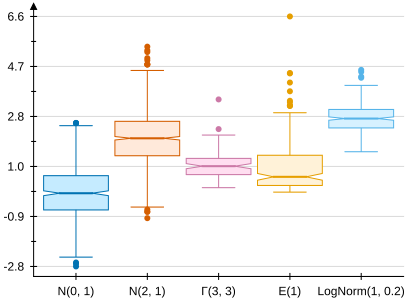
Types of plots in VectSharp.Plots
|
|
|
||||||
|
|
|
||||||
|
|
|
||||||
|
|
|
General information
A plot is represented as a Plot object, containing multiple elemnts that implement the IPlotElement interface. This interface requires every plot element to implement two members:
- The
Plotmethod, that is used to draw the plot element on the full plot. - The
CoordinateSystemproperty that is used to specify the coordinate system used by the plot element.
Coordinate systems
Conceptually, a coordinate system is a function that transforms elements from the “data space” to the “plot space”. For example, a coordinate system could be used to maps values in $\mathbb{R}^2$ to points on the plot surface, which will have a finite and small range, e.g. from $\left \{ 0, 0 \right \}$ to $\left \{ 350, 250 \right \}$. The data space does not necessarily have to be a vector space; for example, a coordinate system could transform strings (e.g., categories) to points.
Coordinate systems implement the ICoordinateSystem<T> interface, where T is the type of the data space (e.g., double[] or string). This interface requires the implementation of a method Point ToPlotCoordinates(T dataPoint), which does the conversion between data space and plot space.
For certain kinds of data spaces (e.g. $R^n$, where T is double[]), the coordinate system may be able to make additional guarantees about the transformation. If the coordinate system implements the IContinuousCoordinateSystem interface, the transformation is guaranteed to be continuous (i.e., arbitrarily close points in the data space will also be arbitrarily close in the plot space). This interface requires four additional members:
- The
bool IsLinearproperty should be set totrueif the transformation is linear (i.e., $f\left (A + k\cdot B \right) = f\left(A \right) + k \cdot f \left (B\right)$). -
In cases where the transformation is not linear, the
bool IsDirectionStraight(IReadOnlyList<double> direction)method should returntrueif data points alongdirectionwill all be transformed into plot points that lie on the same line. Note that this does not necessarily mean that transformations alongdirectionare linear.For example, a logarithmic coordinate system $f\left ( \left \{ x, y \right \} \right ) = \left \{ \log(x), \log(y) \right \}$ is not linear along any direction, but respects this property for data points along lines parallel to each of the two axes.
-
The
double[] Resolutionproperty should return a value (in data space) specifying how close two points have to be in data space in order for them to be practically indistinguishable in plot space. Where this is not well-defined (or where the value should change depending on the location of the points, such as in a logarithmic coordinate system), a reasonable approximation should be returned. - The
double[] GetAround(IReadOnlyList<double> point, IReadOnlyList<double> direction)method should return a point in data space that is arbitrarily close to the suppliedpoint, along the specifieddirection. This is similar to theResolutionproperty, but can produce different values for each point and each direction.
Furthermore, if the transformation is invertible, the coordinate system can implement the IContinuousInvertibleCoordinateSystem interface, which defines an additional method double[] ToDataCoordinates(Point plotPoint) that should perform the inverse transformation (from plot space to data space).
VectSharp.Plots implements some commonly-used coordinate systems:
-
A
\[f \left ( \left \{ x, y \right \} \right ) = \left \{ \frac{x - x_{min}}{x_{max} - x_{min}} \cdot w, \left ( 1 - \frac{y - y_{min}}{y_{max} - y_{min}} \right ) \cdot h \right \}\]LinearCoordinateSystem2Dis a continuous invertible coordinate system, converting points in $R^2$ (represented asdouble[]s orIReadOnlyList<double>s) using a linear transformation. Given six values $x_{min}$, $x_{max}$, $y_{min}$, $y_{max}$, $w$ and $h$, the direct transformation is:This class has three constructors. In the constructor accepting six
doubleparameters, the six values are specified directly; in the constructors accepting a collection of data points (either as anIReadOnlyList<IReadOnlyList<double>>or as adouble[n, 2]2D array), $x_{min}$, $x_{max}$, $y_{min}$, $y_{max}$ are determined from the data, while $w$ and $h$ are specified as additional parameters. -
A
\[f \left ( \left \{ x, y \right \} \right ) = \left \{ \frac{\log \left (x \right) - \log \left (x_{min} \right )}{\log \left (x_{max}\right ) - \log \left (x_{min}\right )} \cdot w, \left ( 1 - \frac{\log \left (y \right )- \log \left (y_{min}\right )}{\log \left (y_{max}\right ) - \log \left (y_{min} \right )} \right ) \cdot h \right \}\]LogarithmicCoordinateSystem2Dis another continuous invertible coordinate system, which transforms points using a logarithmic transformation. Given $x_{min}$, $x_{max}$, $y_{min}$, $y_{max}$, $w$ and $h$, the direct transformation is:Like a
LinearCoordinateSystem2D, aLogarithmicCoordinateSystem2Dcan be constructed either by providing the six values, or by providing a collection of data points. -
A
\[f \left ( \left \{ x, y \right \} \right ) = \left \{ \frac{\log \left (x \right) - \log \left (x_{min} \right )}{\log \left (x_{max}\right ) - \log \left (x_{min}\right )} \cdot w, \left ( 1 - \frac{y - y_{min}}{y_{max} - y_{min}} \right ) \cdot h \right \}\]LinLogCoordinateSystem2Dperforms a logarithmic transformation on the $x$ axis, and a linear transformation on the $y$ axis:Like a
LinearCoordinateSystem2D, aLinLogCoordinateSystem2Dcan be constructed either by providing the six values, or by providing a collection of data points. -
A
\[f \left ( \left \{ x, y \right \} \right ) = \left \{ \frac{x - x_{min}}{x_{max} - x_{min}} \cdot w, \left ( 1 - \frac{\log \left (y \right )- \log \left (y_{min}\right )}{\log \left (y_{max}\right ) - \log \left (y_{min} \right )} \right ) \cdot h \right \}\]LogLinCoordinateSystem2Dperforms a logarithmic transformation on the $y$ axis, and a linear transformation on the $x$ axis:Like a
LinearCoordinateSystem2D, aLogLinCoordinateSystem2Dcan be constructed either by providing the six values, or by providing a collection of data points. -
A
CoordinateSystem<T>can be used if you want to specify a custom method to compute the coordinates without creating a whole new implementation of theICoordinateSystem2Dinterface. The constructor for this type requires the method used to compute the coordinates as a parameter.
In addition to these classes, a number of classes and interfaces are defined dealing with 1-D coordinate systems. The intention is that these can be combined flexibly to create 2D coordinate systems. The ICoordinateSystem1D<T> interface defines a 1-D coordinate system and requires the implementation of a method double ToPlotCoordinates(T dataPoint), converting a point in data space to a double (e.g., a coordinate along one of the axes of the plot). Four implementations of this interface are provided:
-
A
LinearCoordinateSystem1Dis a like aLinearCoordinateSystem2D, but for a single coordinate. -
A
LogarithmicCoordinateSystem1Dis a like aLogarithmicCoordinateSystem2D, but for a single coordinate. -
A
CategoricalCoordinateSystem1D<T>assigns a coordinate value to a object of typeT, whereTis a type that can have discrete values (e.g., astringor achar). This class can be initialised either by providing aDictionary<T, double>containing the coordinate values, or by providing a list of all the possible values, which will be used to build the dictionary internally. -
A
CoordinateSystem1Duses a custom method to compute the plot coordinate. You can use this if you want to specify a the way the coordinates should be computed without creating a whole class implementing theICoordinateSystem1Dinterface.
The class CompositeCoordinateSystem2D<T1, T2> can be used to combine two ICoordinateSyste1Ds to produce a 2D coordinate system. This could be used, e.g. to combine a categorical coordinate system and a linear coordinate system to produce a hybrid coordinate system to use in a histogram.