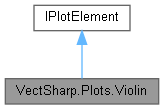
A plot element that draws a violin plot.
More...
|
| IReadOnlyList< double > | Position [get, set] |
| | The position of the origin of the violin (e.g., the 0 in data space coordinates). More...
|
| |
| IReadOnlyList< double > | Direction [get, set] |
| | The direction along which the violin is drawn, in data space coordinates. More...
|
| |
| double | Width = 10 [get, set] |
| | The width of the violin in data space coordinates. More...
|
| |
| bool | Smooth = true [get, set] |
| | Determines whether the violin is smoothed or not. More...
|
| |
| ViolinSide | Sides = ViolinSide.Both [get, set] |
| | Determines on which side(s) the violin is drawn. More...
|
| |
| IReadOnlyList< double > | Data [get, set] |
| | The values whose distribution is displayed by the violin plot. More...
|
| |
| int | MaxBins = int.MaxValue [get, set] |
| | Maximum number of bins. More...
|
| |
| PlotElementPresentationAttributes | PresentationAttributes = new PlotElementPresentationAttributes() { Fill = Colours.White } [get, set] |
| | Presentation attributes for the violin plot. More...
|
| |
| ICoordinateSystem< IReadOnlyList< double > > | CoordinateSystem [get, set] |
| | The coordinate system used to transform the points from data space to plot space. More...
|
| |
| string | Tag [get, set] |
| | A tag to identify the violin in the plot. More...
|
| |
| ICoordinateSystem | CoordinateSystem [get] |
| | The coordinate system used to transform the points from data space to plot space. More...
|
| |
A plot element that draws a violin plot.
Definition at line 27 of file Violin.cs.
◆ ViolinSide
The sides on which a violin can be drawn.
Definition at line 32 of file Violin.cs.
◆ Violin()
| VectSharp.Plots.Violin.Violin |
( |
IReadOnlyList< double > |
position, |
|
|
IReadOnlyList< double > |
direction, |
|
|
IReadOnlyList< double > |
data, |
|
|
ICoordinateSystem< IReadOnlyList< double > > |
coordinateSystem |
|
) |
| |
Create a new Violin instance.
- Parameters
-
| position | The position of the origin of the violin (e.g., the 0 in data space coordinates). |
| direction | The direction along which the violin is drawn, in data space coordinates. |
| data | The values whose distribution is displayed by the violin plot. |
| coordinateSystem | The coordinate system used to transform the points from data space to plot space. |
Definition at line 108 of file Violin.cs.
◆ Plot()
| void VectSharp.Plots.Violin.Plot |
( |
Graphics |
target | ) |
|
◆ CoordinateSystem
◆ Data
| IReadOnlyList<double> VectSharp.Plots.Violin.Data |
|
getset |
The values whose distribution is displayed by the violin plot.
Definition at line 78 of file Violin.cs.
◆ Direction
| IReadOnlyList<double> VectSharp.Plots.Violin.Direction |
|
getset |
The direction along which the violin is drawn, in data space coordinates.
Definition at line 58 of file Violin.cs.
◆ MaxBins
| int VectSharp.Plots.Violin.MaxBins = int.MaxValue |
|
getset |
Maximum number of bins.
Definition at line 83 of file Violin.cs.
◆ Position
| IReadOnlyList<double> VectSharp.Plots.Violin.Position |
|
getset |
The position of the origin of the violin (e.g., the 0 in data space coordinates).
Definition at line 53 of file Violin.cs.
◆ PresentationAttributes
Presentation attributes for the violin plot.
Definition at line 88 of file Violin.cs.
◆ Sides
| ViolinSide VectSharp.Plots.Violin.Sides = ViolinSide.Both |
|
getset |
Determines on which side(s) the violin is drawn.
Definition at line 73 of file Violin.cs.
◆ Smooth
| bool VectSharp.Plots.Violin.Smooth = true |
|
getset |
Determines whether the violin is smoothed or not.
Definition at line 68 of file Violin.cs.
◆ Tag
| string VectSharp.Plots.Violin.Tag |
|
getset |
A tag to identify the violin in the plot.
Definition at line 99 of file Violin.cs.
◆ Width
| double VectSharp.Plots.Violin.Width = 10 |
|
getset |
The width of the violin in data space coordinates.
Definition at line 63 of file Violin.cs.
The documentation for this class was generated from the following file:

 Properties inherited from VectSharp.Plots.IPlotElement