|
VectSharp 2.6.1
A light library for C# vector graphics
|
|
VectSharp 2.6.1
A light library for C# vector graphics
|
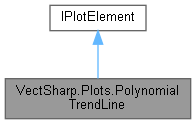
A plot element that draws a polynomial trendline with equation y = a0 + a1 * x + a2 * x^2 + ... + aN * x^N.
More...
Public Member Functions | |||
| PolynomialTrendLine (double[] coefficients, double minX, double minY, double maxX, double maxY, IContinuousCoordinateSystem coordinateSystem) | |||
| Create a new LinearTrendLine instance, specifying the coefficients. More... | |||
| PolynomialTrendLine (IReadOnlyList< IReadOnlyList< double > > data, int order, IContinuousCoordinateSystem coordinateSystem, double? fixedIntercept=null) | |||
| Create a new PolynomialTrendLine instance, determining the coefficients by running a regression. More... | |||
| PolynomialTrendLine (IReadOnlyList<(double, double)> data, int order, IContinuousCoordinateSystem coordinateSystem, double? fixedIntercept=null) | |||
| Create a new PolynomialTrendLine instance, determining the coefficients by running a regression. More... | |||
| void | Plot (Graphics target) | ||
Draw the plot element on the specified target  Graphics.
| |||
| void | Plot (Graphics target) | ||
| Draw the plot element on the specified target  Graphics. More... | |||
Properties | |
| double[] | Coefficients [get, set] |
The coefficients (a0 ... aN). More... | |
| double | MinX [get, set] |
| The minimum X value for which the trendline is plotted. More... | |
| double | MinY [get, set] |
| The minimum Y value for which the trendline is plotted. More... | |
| double | MaxX [get, set] |
| The maximum X value for which the trendline is plotted. More... | |
| double | MaxY [get, set] |
| The maximum Y value for which the trendline is plotted. More... | |
| PlotElementPresentationAttributes | PresentationAttributes = new PlotElementPresentationAttributes() { LineDash = new LineDash(5, 5, 0), Stroke = Colour.FromRgb(180, 180, 180) } [get, set] |
| Presentation attributes for the trendline. More... | |
| string | Tag [get, set] |
| A tag to identify the trendline in the plot. More... | |
| IContinuousCoordinateSystem | CoordinateSystem [get, set] |
| The coordinate system used to transform the points from data space to plot space. More... | |
 Properties inherited from VectSharp.Plots.IPlotElement Properties inherited from VectSharp.Plots.IPlotElement | |
| ICoordinateSystem | CoordinateSystem [get] |
| The coordinate system used to transform the points from data space to plot space. More... | |
A plot element that draws a polynomial trendline with equation y = a0 + a1 * x + a2 * x^2 + ... + aN * x^N.
Definition at line 685 of file Trendlines.cs.
| VectSharp.Plots.PolynomialTrendLine.PolynomialTrendLine | ( | double[] | coefficients, |
| double | minX, | ||
| double | minY, | ||
| double | maxX, | ||
| double | maxY, | ||
| IContinuousCoordinateSystem | coordinateSystem | ||
| ) |
Create a new LinearTrendLine instance, specifying the coefficients.
| coefficients | The coefficients (a0 ... aN). |
| minX | The minimum X value for which the trendline is plotted. |
| minY | The minimum Y value for which the trendline is plotted. |
| maxX | The maximum X value for which the trendline is plotted. |
| maxY | The maximum Y value for which the trendline is plotted. |
| coordinateSystem | The coordinate system used to transform the points from data space to plot space. |
Definition at line 736 of file Trendlines.cs.
| VectSharp.Plots.PolynomialTrendLine.PolynomialTrendLine | ( | IReadOnlyList< IReadOnlyList< double > > | data, |
| int | order, | ||
| IContinuousCoordinateSystem | coordinateSystem, | ||
| double? | fixedIntercept = null |
||
| ) |
Create a new PolynomialTrendLine instance, determining the coefficients by running a regression.
| data | The data that will be used to determine the coefficients. |
| order | The order of the polynomial (N). This must be ≥ 2. |
| coordinateSystem | The coordinate system used to transform the points from data space to plot space. |
| fixedIntercept | If this is null, the intercept (a0) is determined during the regression; otherwise, it is fixed to the specified value. |
| ArgumentOutOfRangeException | Thrown if the order is < 2. |
Definition at line 777 of file Trendlines.cs.
| VectSharp.Plots.PolynomialTrendLine.PolynomialTrendLine | ( | IReadOnlyList<(double, double)> | data, |
| int | order, | ||
| IContinuousCoordinateSystem | coordinateSystem, | ||
| double? | fixedIntercept = null |
||
| ) |
Create a new PolynomialTrendLine instance, determining the coefficients by running a regression.
| data | The data that will be used to determine the coefficients. |
| order | The order of the polynomial (N). This must be ≥ 2. |
| coordinateSystem | The coordinate system used to transform the points from data space to plot space. |
| fixedIntercept | If this is null, the intercept (a0) is determined during the regression; otherwise, it is fixed to the specified value. |
| ArgumentOutOfRangeException | Thrown if the order is < 2. |
Definition at line 830 of file Trendlines.cs.
| void VectSharp.Plots.PolynomialTrendLine.Plot | ( | Graphics | target | ) |
Draw the plot element on the specified target  Graphics.
| target | The Graphics on which to draw. |
Implements VectSharp.Plots.IPlotElement.
Definition at line 833 of file Trendlines.cs.
|
getset |
The coefficients (a0 ... aN).
Definition at line 690 of file Trendlines.cs.
|
getset |
The coordinate system used to transform the points from data space to plot space.
Implements VectSharp.Plots.IPlotElement.
Definition at line 724 of file Trendlines.cs.
|
getset |
The maximum X value for which the trendline is plotted.
Definition at line 704 of file Trendlines.cs.
|
getset |
The maximum Y value for which the trendline is plotted.
Definition at line 709 of file Trendlines.cs.
|
getset |
The minimum X value for which the trendline is plotted.
Definition at line 694 of file Trendlines.cs.
|
getset |
The minimum Y value for which the trendline is plotted.
Definition at line 699 of file Trendlines.cs.
|
getset |
Presentation attributes for the trendline.
Definition at line 714 of file Trendlines.cs.
|
getset |
A tag to identify the trendline in the plot.
Definition at line 719 of file Trendlines.cs.