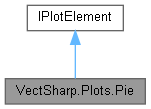
A plot element that draws a pie or a doughnut.
More...
|
| | Pie (IReadOnlyList< double > data, IReadOnlyList< double > centre, IReadOnlyList< double > radius, ICoordinateSystem< IReadOnlyList< double > > coordinateSystem) |
| | Create a new Pie instance drawing a pie chart. More...
|
| |
| | Pie (IReadOnlyList< double > data, IReadOnlyList< double > centre, IReadOnlyList< double > innerRadius, IReadOnlyList< double > outerRadius, ICoordinateSystem< IReadOnlyList< double > > coordinateSystem) |
| | Create a new Pie instance drawing a doughnut chart. More...
|
| |
| void | Plot (Graphics target) |
| | Draw the plot element on the specified target  Graphics. - Parameters
-
More...
|
| |
| void | Plot (Graphics target) |
| | Draw the plot element on the specified target  Graphics. More...
|
| |
|
| IReadOnlyList< double > | Data [get, set] |
| | The data in the pie chart. The values do not need to be normalised. More...
|
| |
| IReadOnlyList< double > | Centre [get, set] |
| | The centre of the pie/doughnut, in data coordinates. More...
|
| |
| IReadOnlyList< double > | OuterRadius [get, set] |
| | The outer radius of the pie/doughnut, in data coordinates. More...
|
| |
| IReadOnlyList< double > | InnerRadius [get, set] |
| | The inner radius of the doughnut, in data coordinates. Set to [0, 0] for a pie chart. More...
|
| |
| double | StartAngle = 0 [get, set] |
| | The initial angle starting from which the pie slices are drawn. More...
|
| |
| bool | Clockwise = false [get, set] |
| | Determines whether the slices are drawn in clockwise or anti-clockwise fashion. More...
|
| |
| ICoordinateSystem< IReadOnlyList< double > > | CoordinateSystem [get, set] |
| | The coordinate system used to transform the points from data space to plot space. More...
|
| |
| IReadOnlyList< PlotElementPresentationAttributes > | PresentationAttributes = new PlotElementPresentationAttributes[] { new PlotElementPresentationAttributes() } [get, set] |
| | Presentation attributes for the slices. An element from this collection is used for each slice in the pie/doughnut; if there are more slices than elements in this collection, the presentation attributes are wrapped. More...
|
| |
| string | Tag [get, set] |
| | A tag to identify the pie/doughnut in the plot. More...
|
| |
| ICoordinateSystem | CoordinateSystem [get] |
| | The coordinate system used to transform the points from data space to plot space. More...
|
| |
A plot element that draws a pie or a doughnut.
Definition at line 27 of file Pie.cs.
◆ Pie() [1/2]
| VectSharp.Plots.Pie.Pie |
( |
IReadOnlyList< double > |
data, |
|
|
IReadOnlyList< double > |
centre, |
|
|
IReadOnlyList< double > |
radius, |
|
|
ICoordinateSystem< IReadOnlyList< double > > |
coordinateSystem |
|
) |
| |
Create a new Pie instance drawing a pie chart.
- Parameters
-
| data | The data in the pie chart. The values do not need to be normalised. |
| centre | The centre of the pie, in data coordinates. |
| radius | The radius of the pie, in data coordinates. |
| coordinateSystem | The coordinate system used to transform the points from data space to plot space. |
Definition at line 84 of file Pie.cs.
◆ Pie() [2/2]
| VectSharp.Plots.Pie.Pie |
( |
IReadOnlyList< double > |
data, |
|
|
IReadOnlyList< double > |
centre, |
|
|
IReadOnlyList< double > |
innerRadius, |
|
|
IReadOnlyList< double > |
outerRadius, |
|
|
ICoordinateSystem< IReadOnlyList< double > > |
coordinateSystem |
|
) |
| |
Create a new Pie instance drawing a doughnut chart.
- Parameters
-
| data | The data in the doughnut chart. The values do not need to be normalised. |
| centre | The centre of the doughnut, in data coordinates. |
| innerRadius | The inner radius of the doughnut, in data coordinates. |
| outerRadius | The outer radius of the doughnut, in data coordinates. |
| coordinateSystem | The coordinate system used to transform the points from data space to plot space. |
Definition at line 101 of file Pie.cs.
◆ Plot()
| void VectSharp.Plots.Pie.Plot |
( |
Graphics |
target | ) |
|
◆ Centre
| IReadOnlyList<double> VectSharp.Plots.Pie.Centre |
|
getset |
The centre of the pie/doughnut, in data coordinates.
Definition at line 37 of file Pie.cs.
◆ Clockwise
| bool VectSharp.Plots.Pie.Clockwise = false |
|
getset |
Determines whether the slices are drawn in clockwise or anti-clockwise fashion.
Definition at line 57 of file Pie.cs.
◆ CoordinateSystem
◆ Data
| IReadOnlyList<double> VectSharp.Plots.Pie.Data |
|
getset |
The data in the pie chart. The values do not need to be normalised.
Definition at line 32 of file Pie.cs.
◆ InnerRadius
| IReadOnlyList<double> VectSharp.Plots.Pie.InnerRadius |
|
getset |
The inner radius of the doughnut, in data coordinates. Set to [0, 0] for a pie chart.
Definition at line 47 of file Pie.cs.
◆ OuterRadius
| IReadOnlyList<double> VectSharp.Plots.Pie.OuterRadius |
|
getset |
The outer radius of the pie/doughnut, in data coordinates.
Definition at line 42 of file Pie.cs.
◆ PresentationAttributes
Presentation attributes for the slices. An element from this collection is used for each slice in the pie/doughnut; if there are more slices than elements in this collection, the presentation attributes are wrapped.
Definition at line 70 of file Pie.cs.
◆ StartAngle
| double VectSharp.Plots.Pie.StartAngle = 0 |
|
getset |
The initial angle starting from which the pie slices are drawn.
Definition at line 52 of file Pie.cs.
◆ Tag
| string VectSharp.Plots.Pie.Tag |
|
getset |
A tag to identify the pie/doughnut in the plot.
Definition at line 75 of file Pie.cs.
The documentation for this class was generated from the following file:

 Properties inherited from VectSharp.Plots.IPlotElement