|
VectSharp 2.6.1
A light library for C# vector graphics
|
|
VectSharp 2.6.1
A light library for C# vector graphics
|
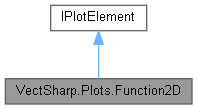
A plot element that plots a function of two variables. More...

Public Types | |
| enum | PlotType |
| Describes the kind of plots that can be produced. More... | |
Public Member Functions | |||
| Function2D (Function2DGrid function, IContinuousInvertibleCoordinateSystem coordinateSystem) | |||
| Create a new Function2D instance. More... | |||
| unsafe void | Plot (Graphics target) | ||
Draw the plot element on the specified target  Graphics.
| |||
| void | Plot (Graphics target) | ||
| Draw the plot element on the specified target  Graphics. More... | |||
Properties | |
| IDataPointElement | SampledPointElement = new PathDataPointElement() [get, set] |
| The symbol to draw at the sampled points. More... | |
| int | RasterResolutionX = 512 [get, set] |
| Resolution on the X axis for the rasterised tesselation. More... | |
| int | RasterResolutionY = 512 [get, set] |
| Resolution on the Y axis for the rasterised tesselation. More... | |
| Function2DGrid | Function [get, set] |
| The function to plot. More... | |
| PlotType | Type = PlotType.SampledPoints [get, set] |
| The kind of plot that is produced. More... | |
| Func< double, Colour > | Colouring = x => { x = Math.Max(0, Math.Min(1, x)); return Colour.FromRgb(x, x, x); } [get, set] |
A function associating sampled function values to a Colour. You should set this to a function accepting a single double argument ranging between 0 and 1, and returning the corresponding colour. The default value returns black 0 and white for 1. More... | |
| string | Tag [get, set] |
| A tag to identify the function in the plot. More... | |
| IContinuousInvertibleCoordinateSystem | CoordinateSystem [get, set] |
| The coordinate system used to transform the points from data space to plot space. More... | |
 Properties inherited from VectSharp.Plots.IPlotElement Properties inherited from VectSharp.Plots.IPlotElement | |
| ICoordinateSystem | CoordinateSystem [get] |
| The coordinate system used to transform the points from data space to plot space. More... | |
A plot element that plots a function of two variables.
Definition at line 520 of file Function2D.cs.
Describes the kind of plots that can be produced.
Definition at line 525 of file Function2D.cs.
| VectSharp.Plots.Function2D.Function2D | ( | Function2DGrid | function, |
| IContinuousInvertibleCoordinateSystem | coordinateSystem | ||
| ) |
Create a new Function2D instance.
| function | The function to plot. |
| coordinateSystem | The coordinate system used to transform the points from data space to plot space. |
Definition at line 594 of file Function2D.cs.
| unsafe void VectSharp.Plots.Function2D.Plot | ( | Graphics | target | ) |
Draw the plot element on the specified target  Graphics.
| target | The Graphics on which to draw. |
Implements VectSharp.Plots.IPlotElement.
Definition at line 601 of file Function2D.cs.
|
getset |
A function associating sampled function values to a Colour. You should set this to a function accepting a single double argument ranging between 0 and 1, and returning the corresponding colour. The default value returns black 0 and white for 1.
Definition at line 576 of file Function2D.cs.
|
getset |
The coordinate system used to transform the points from data space to plot space.
Implements VectSharp.Plots.IPlotElement.
Definition at line 586 of file Function2D.cs.
|
getset |
The function to plot.
Definition at line 564 of file Function2D.cs.
|
getset |
Resolution on the X axis for the rasterised tesselation.
Definition at line 554 of file Function2D.cs.
|
getset |
Resolution on the Y axis for the rasterised tesselation.
Definition at line 559 of file Function2D.cs.
|
getset |
The symbol to draw at the sampled points.
Definition at line 549 of file Function2D.cs.
|
getset |
A tag to identify the function in the plot.
Definition at line 581 of file Function2D.cs.
|
getset |
The kind of plot that is produced.
Definition at line 569 of file Function2D.cs.