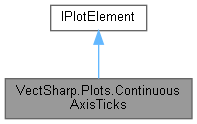
A plot element that draws equally spaced ticks on an axis.
More...
|
| IReadOnlyList< double > | StartPoint [get, set] |
| | The starting point of the axis, expressed in data space coordinates. More...
|
| |
| IReadOnlyList< double > | EndPoint [get, set] |
| | The ending point of the axis, expressed in data space coordinates. More...
|
| |
| double | IntervalCount = 10 [get, set] |
| | The number of intervals between ticks. Note that the number of ticks will be one greater than this. More...
|
| |
| Func< int, double > | SizeAbove = i => i % 2 == 0 ? 3 : 2 [get, set] |
| | The size of the ticks "above" the axis. What "above" means depends on the orientation of the axis. This should be set to a function accepting an int argument representing the index of the tick, and return a double representing the size of the tick in plot coordinates. More...
|
| |
| Func< int, double > | SizeBelow = i => i % 2 == 0 ? 3 : 2 [get, set] |
| | The size of the ticks "below" the axis. What "below" means depends on the orientation of the axis. This should be set to a function accepting an int argument representing the index of the tick, and return a double representing the size of the tick in plot coordinates. More...
|
| |
| IContinuousCoordinateSystem | CoordinateSystem [get, set] |
| | The coordinate system used to transform the points from data space to plot space. More...
|
| |
| PlotElementPresentationAttributes | PresentationAttributes = new PlotElementPresentationAttributes() [get, set] |
| | Presentation attributes determining the appearance of the ticks. More...
|
| |
| string | Tag [get, set] |
| | A tag to identify the ticks in the plot. More...
|
| |
| ICoordinateSystem | CoordinateSystem [get] |
| | The coordinate system used to transform the points from data space to plot space. More...
|
| |
A plot element that draws equally spaced ticks on an axis.
Definition at line 167 of file Axes.cs.
◆ ContinuousAxisTicks()
| VectSharp.Plots.ContinuousAxisTicks.ContinuousAxisTicks |
( |
IReadOnlyList< double > |
startPoint, |
|
|
IReadOnlyList< double > |
endPoint, |
|
|
IContinuousCoordinateSystem |
coordinateSystem |
|
) |
| |
Creates a new ContinuousAxisTicks instance.
- Parameters
-
| startPoint | The starting point of the axis, expressed in data space coordinates. |
| endPoint | The ending point of the axis, expressed in data space coordinates. |
| coordinateSystem | The coordinate system used to transform the points from data space to plot space. |
Definition at line 220 of file Axes.cs.
◆ Plot()
| void VectSharp.Plots.ContinuousAxisTicks.Plot |
( |
Graphics |
target | ) |
|
◆ CoordinateSystem
◆ EndPoint
| IReadOnlyList<double> VectSharp.Plots.ContinuousAxisTicks.EndPoint |
|
getset |
The ending point of the axis, expressed in data space coordinates.
Definition at line 177 of file Axes.cs.
◆ IntervalCount
| double VectSharp.Plots.ContinuousAxisTicks.IntervalCount = 10 |
|
getset |
The number of intervals between ticks. Note that the number of ticks will be one greater than this.
Definition at line 182 of file Axes.cs.
◆ PresentationAttributes
Presentation attributes determining the appearance of the ticks.
Definition at line 207 of file Axes.cs.
◆ SizeAbove
| Func<int, double> VectSharp.Plots.ContinuousAxisTicks.SizeAbove = i => i % 2 == 0 ? 3 : 2 |
|
getset |
The size of the ticks "above" the axis. What "above" means depends on the orientation of the axis. This should be set to a function accepting an int argument representing the index of the tick, and return a double representing the size of the tick in plot coordinates.
Definition at line 189 of file Axes.cs.
◆ SizeBelow
| Func<int, double> VectSharp.Plots.ContinuousAxisTicks.SizeBelow = i => i % 2 == 0 ? 3 : 2 |
|
getset |
The size of the ticks "below" the axis. What "below" means depends on the orientation of the axis. This should be set to a function accepting an int argument representing the index of the tick, and return a double representing the size of the tick in plot coordinates.
Definition at line 196 of file Axes.cs.
◆ StartPoint
| IReadOnlyList<double> VectSharp.Plots.ContinuousAxisTicks.StartPoint |
|
getset |
The starting point of the axis, expressed in data space coordinates.
Definition at line 172 of file Axes.cs.
◆ Tag
| string VectSharp.Plots.ContinuousAxisTicks.Tag |
|
getset |
A tag to identify the ticks in the plot.
Definition at line 212 of file Axes.cs.
The documentation for this class was generated from the following file:

 Properties inherited from VectSharp.Plots.IPlotElement